Opening up closure traces
Perimeter Associate Faculty member Avery Broderick and his collaborator, Dominic Pesce, have developed a tool that promises to accelerate progress in radio astronomy – the first of its kind in more than 60 years.
Take a self-guided tour from quantum to cosmos!
Perimeter Associate Faculty member Avery Broderick and his collaborator, Dominic Pesce, have developed a tool that promises to accelerate progress in radio astronomy – the first of its kind in more than 60 years.

Work smarter, not harder.
That was the approach that Perimeter Associate Faculty member Avery Broderick took when faced with the challenge of ensuring an enormous amount of data was not, as he puts it, “screwed up.” But he and collaborator Dominic Pesce – a postdoctoral fellow at the Center for Astrophysics of the Harvard College Observatory and the Smithsonian Astrophysical Observatory – didn’t anticipate that what they would discover in the process might revolutionize the field of radio astronomy.
Through a very clever application of relatively simple mathematics, Broderick and Pesce discovered a new observational quantity, dubbed “closure traces,” which can be used to bypass the errors associated with any individual telescope in a collective. They describe their work in a paper published this week in The Astrophysical Journal.
“There’s a new window that’s now been opened on the universe,” says Broderick. “It’s been opened not with a billion dollar instrument, not with a massive development effort to construct new detectors, but because we did some clever math that’s going to allow us to take the data we have already – from experiments that have been performed for 30 years – and analyze them in a way that will improve their sensitivity by orders of magnitude.”
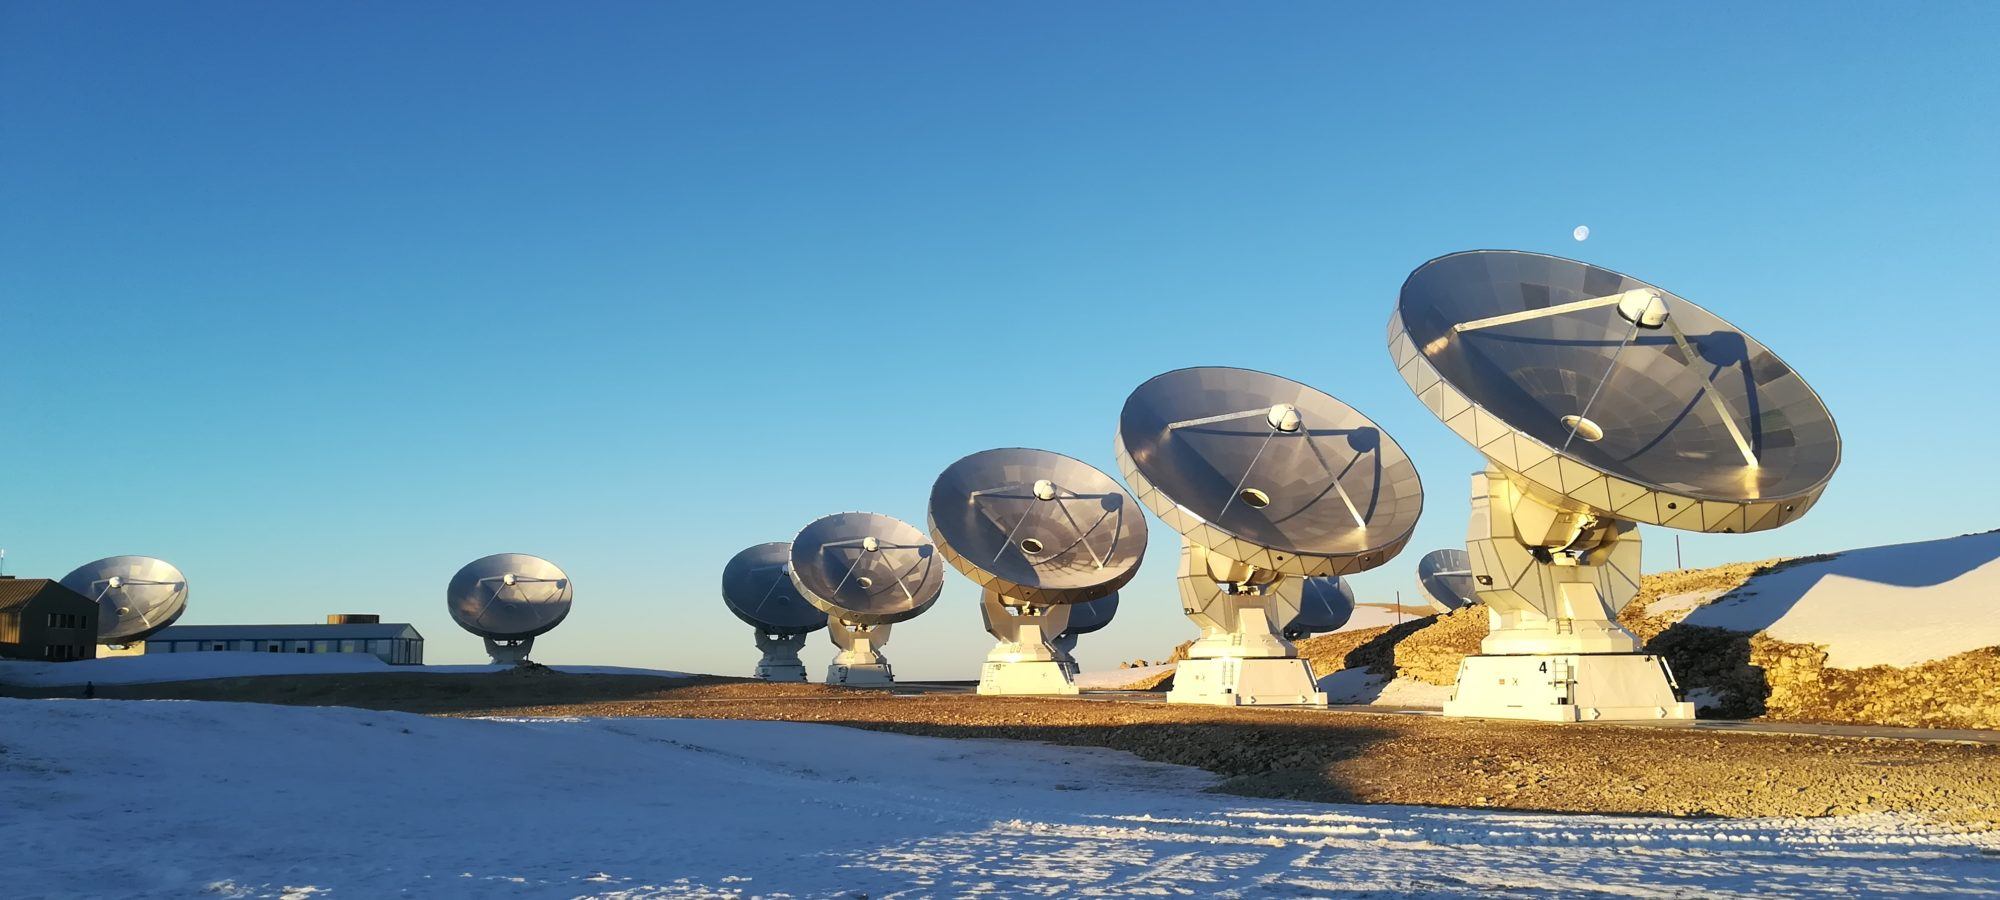
The data that spurred the discovery came from the Event Horizon Telescope (EHT) – the global collaboration that last year shared humanity’s first ever glimpse of a black hole. Taking the landmark image was a formidable challenge that required upgrading and connecting a worldwide network of eight pre-existing telescopes. Using a technique called very-long-baseline interferometry (VLBI), the individual telescopes could combine observations, acting as one giant, Earth-sized observatory.

“The EHT is a cutting-edge instrument,” says Broderick, an EHT researcher who also holds the Delaney Family John Archibald Wheeler Chair at Perimeter. “It produces an extraordinary dataset unlike any previous dataset – much higher resolution, access to the kinds of physics that were never accessible before.
“But we have all kinds of problems that no other dataset has,” he adds.
One of the main difficulties stems from the fact that each individual telescope collects light in its own unique way. The uncertainty in the total measurement is affected by the errors and uncertainties at each facility. The problems are particularly bad for a property of light known as polarization.
To understand the challenges that the EHT faces, it helps to look at the anatomy of a light wave. You might be familiar with the term “electromagnetic radiation” – it’s called that because a light wave is made up of an electric field and a magnetic field, which vibrate as they travel through space.

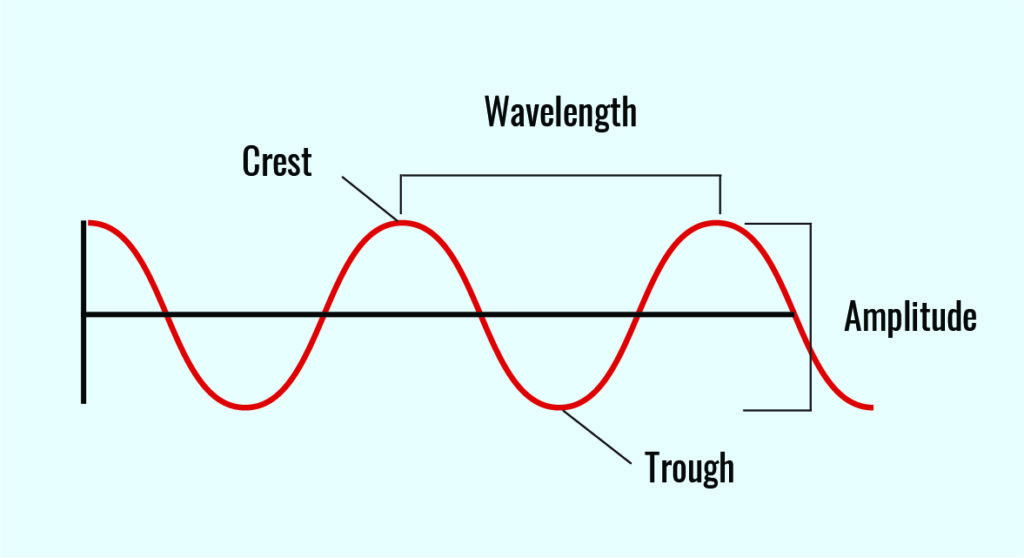
In a vacuum, these waves all travel at the same speed. What differentiates one kind of light from another is the wavelength, or the distance between each crest of the wave. Radio waves have very large wavelengths, which is why such large telescopes are required to detect them. They work, in part, by carefully measuring the “phase” of each wave – essentially when each wave crest hits the detector.
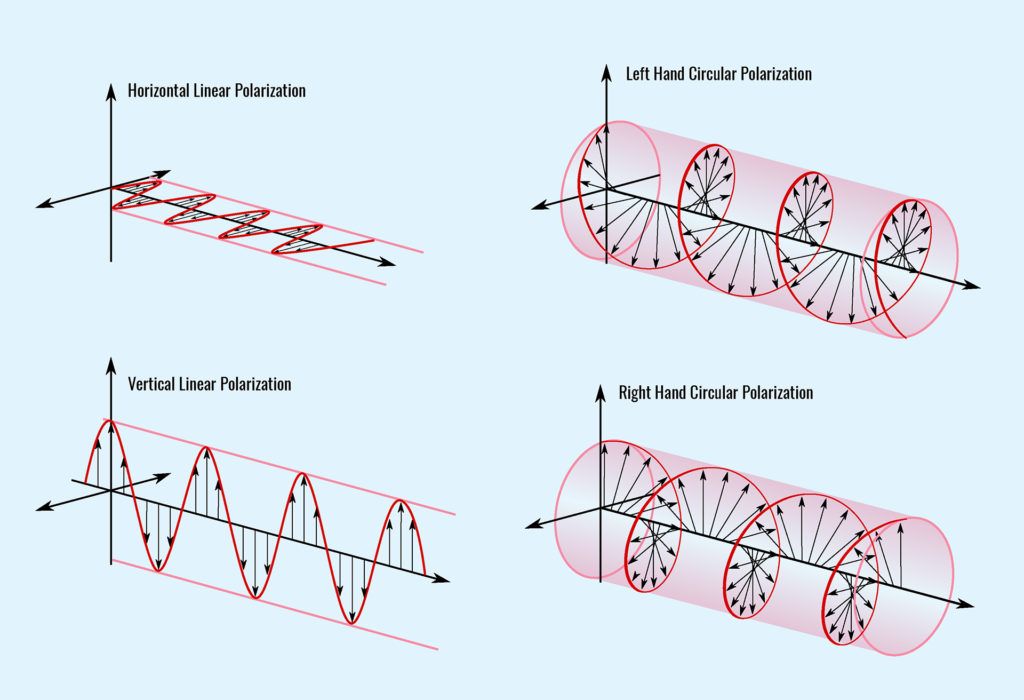
Polarization is a bit more subtle; it’s determined by the alignment and orientation of the electric field, relative to the direction that it’s travelling.
Most sources (like the Sun, an incandescent light bulb, or a flame) emit light that is unpolarized, meaning the direction of the electric field changes randomly. Some light, like that emitted by certain lasers, has an electric field that is highly aligned in a certain direction. The simplest example of this is linear polarization, where the field is confined along one specific plane, but more complicated orientations (circular and elliptical) are also possible.

Polarization can be a powerful diagnostic tool for a researcher. “Astronomically, one of the key things it encodes is magnetic field structures. It’s kind of the astronomical version of dropping iron filings on a bar magnet. We don’t actually get to put the filings on our astronomical source – it’s too far away and requires too much iron,” Broderick says with a laugh. “What we can do is look at the polarized light.”
But there’s a catch. Light from astronomical sources is often only partially polarized, and the weak amount of polarization can be completely washed out in the process of trying to detect it. That’s compounded with an instrument like the EHT, where each telescope may be optimized for a slightly different flavour of polarized light.
“Polarization brings with it all kinds of additional problems,” Broderick says. “Dom and I wanted to know, are those problems because of our analysis? Or are they because the data has problems that we don’t know yet?”
In the late 1950s and early 1960s, radio astronomers developed solutions to mitigate errors associated with measuring a light wave’s phase and amplitude (the size of each wave peak). Both quantities are affected as a light wave passes through the clouds and water vapour in Earth’s atmosphere before hitting the receivers on the ground.
“It’s brutally ironic,” says Broderick. “The wavefront has propagated halfway across the universe to get to us. It has remained unperturbed for almost the entirety of that time. Then it runs into our atmosphere. And in that final, minute step of its journey, it is completely corrupted.”
“The solution,” says Broderick, “is to play a clever mathematical game.”
He invokes a triangle of three telescopes, A, B, and C, all looking at the same star. “It’s true that the phase from Telescope A to B is all screwed up. And it’s true that the phase from B to C is all screwed up. And it is also true that from C back to A, it’s all screwed up,” Broderick explains. The key is this: “They’re all screwed up in a way that is strongly correlated.”
“If you combine the screwed-up phase from A to B, the screwed-up phase from B to C, with the screwed-up phase from C back to A, all of those delays, those corruptions on the wavefront, they cancel out.”
This method of combining the measurements is called a “closure phase.” (A similar method applicable to wave amplitudes is fittingly dubbed a “closure amplitude,” and requires four telescopes instead of three.)
Broderick wondered: could they construct a combination of observations that would similarly cancel out the corruptions in polarization measurements?
“People had thought about this sort of thing in the past – I’m not sure they ever thought that this was likely, that there was going to be a general expression you could use,” he says. He decided it was worth a try. “Maybe I wasn’t smart enough to know you couldn’t do it.”
Drawing inspiration from the work done decades ago, Broderick and Pesce started casting around for ways to combine their observations to circumvent all the errors that can wash out polarization – and they found something.
“I reached back to freshman linear algebra, put it together, and grabbed the thing that seemed to work,” recalls Broderick. “The math has been around for hundreds of years, and now it’s just being applied in the right way.”
They called the new observational quantity a “closure trace.” It doesn’t require a significant increase in observational equipment: like closure amplitudes, it needs a minimum of four telescopes to compute. But the gains in observational power are enormous.
Closure traces did exactly what Broderick and Pesce hoped. “Independent of how the atmosphere affected the wavefront, independent of whether you’ve mislabeled the polarization detectors, independent of all that garbage, I can tell you if a source is polarized,” says Broderick.

But it goes even further: the closure traces also contain all the information you would receive from computing both closure phases and closure amplitudes.
“If you have an array and you’ve computed all your closure traces, you have all the information that’s not associated with the phase calibration, the amplitude calibration, and the polarization leakages – you have every other piece of information that you have left,” Broderick says. “They encode everything except for the systematic uncertainties.”
The result is a powerful new tool for radio astronomers – the first of its kind available in more than 60 years.
“This enterprise at the EHT where you glue together this disparate set of random telescopes around the world – it suddenly becomes really easy, because these closure traces allow you to combine those measurements in a way that doesn’t care about the differences,” says Broderick.
Any experiment looking at polarization could benefit from computing closure traces as a first step, he adds. “Polarized interferometry has been very difficult, because of the large start-up cost of having to go through this onerous calibration process,” he says. “This is going to completely obviate all that.”
“It creates all kinds of opportunities for pushing instruments further than you thought they could go.”
Scientists have discerned a sharp ring of light created by photons whipping around the back of a supermassive black hole in a vivid confirmation of theoretical prediction.
The Event Horizon Telescope collaboration, a globe-spanning consortium of researchers from Perimeter Institute and a dozen partner organizations, has released the first image of the supermassive black hole at the centre of our own galaxy.
A round-up of what’s up: the latest news from Perimeter, a look at the recent work of researchers and alumni, gems from the archive, and fun physics for everyone.